Eight years ago I moved to rural Northeastern Connecticut. It’s beautiful out here and after 20 years of living in urban cores, the switch to the rural lifestyle was something that came fairly naturally for me. However, living in a rural area has some notable drawbacks. There’s no natural gas avialable, so instead we have a 300 gallon tank of fuel oil in our basement. Perhaps, more significantly, when power goes out, it can sometimes take days to be restored. Tropical Storm Isaias came through Connecticut in August 2020 and knocked out our power for a few days. It was annoying, to say the least. I had a generator interlock installed in my house, so I can power parts of my house, but unfortunately, no everything.
After the storm I ordered solar panels and Tesla Powerwalls for my house. I have an 8.64Kw array on my roof, which is not ideal for solar power at all, and three powerwalls in my basement. This will cover most of my power for the year - but it wasn’t cheap at all. In the end, it’s more of a toy that helps reduce some of my bills. The system was activated near the end of November 2020, which means that my first few months saw the array being not all that useful. Some days we’d get as little as 245Wh of electricity. I was pretty dismayed about performance. However, now we’re seeing much better overall performance.
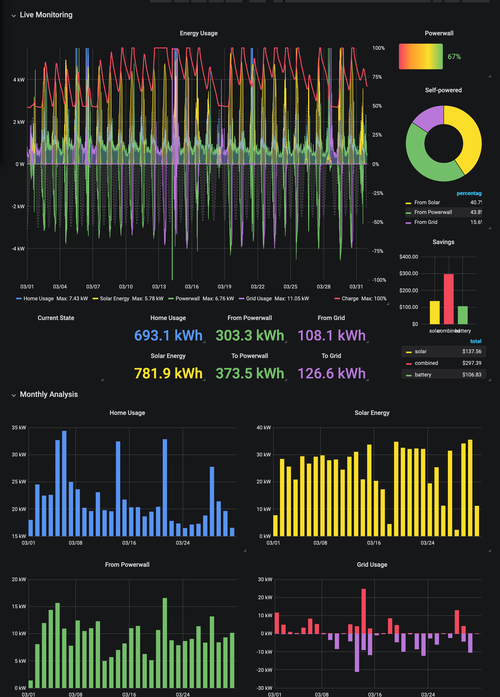
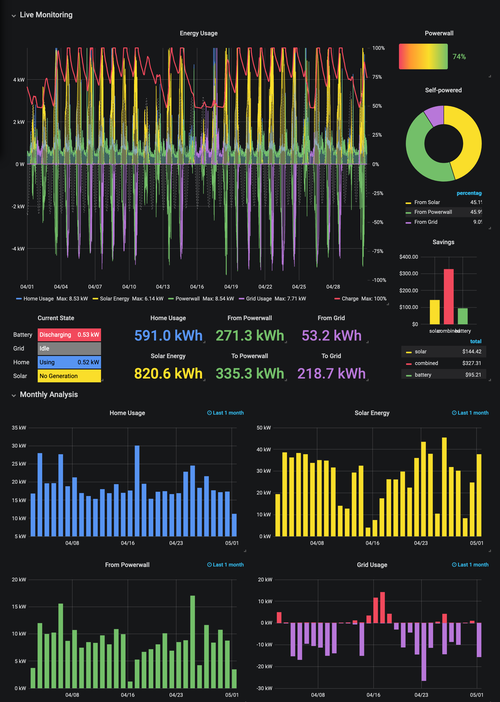
Here’s the performance for the system during the months of March and April of 2021. This was logged through the mihailescu2m/powerwall_monitor project on GitHub. I’m pretty proud that I contributed some notable fixes to the project to make it work with recent API changes.


In both March and April I was net negative for power consumption. However, because of inefficiencies in the DC-AC-DC-AC loop needed for the Powerwalls, it’s not as good as you might think.
| Month | Home Energy Used | Solar Power Harvested | Power from Grid | Power to Grid | Powerwall Loss |
|---|---|---|---|---|---|
| March 2021 | 693.1 kWh | 781.9 kWh | 108.1 kWh | 126.6 kWh | 70.3 kWh |
| April 2021 | 591.0 kWh | 820.6 kWh | 53.2 kWh | 218.7 kWh | 119.0 kWh |
Given that my electricity rate averages out to about $0.21/kWh for supply and delivery, this means that effectively having the Powerwall is costing me an additional $19.87/month. This doesn’t tell the complete story as the Connected Solutions program from Eversource can result in significant savings. However, while there have been a few events when Eversource pulled from my battery, there hasn’t been enough for me to understand the total impact of this program yet.
Another side effect of this setup is that it allows me to feel a lot more self sufficient from the grid. During March there were 18 days in which I consumed < 1 kWh from the grid and April had 22 days where I consumed < 1 kWh. This bodes well for having a robust and stable power supply as the summer storm season approaches again.